
The second quarter of 2017 further emphasized the diverging trends between the British Columbian and Albertan commercial real estate markets. With Vancouver realizing supply constraints across both office and industrial assets through low vacancy rates, the major Albertan markets, Calgary and Edmonton, continue to struggle with the lagging energy market, which is reflected in increased vacancy rates and limited demand.
The major real estate markets in British Columbia and Alberta combine for a total of approximately 655 million square feet of office and industrial inventory. Of this total inventory, industrial space represents approximately 75 per cent (around 483 million square feet) with the remaining 25 per cent being office space (around 162 million square feet).
In the context of the entire Canadian office and industrial inventory (approximately 2.5 billion square feet), around 26 per cent is comprised of the combined inventory of the three major Western Canadian markets. If the industrial component of the combined inventory of the three major Western Canadian markets is compared to the national industrial inventory for Canada as a whole (about 1.9 billion square feet), the major Western Canadian markets comprise roughly 26 per cent of the national total. With respect to the office inventory figures of the major Western Canadian markets, they combine to represent nearly 29 per cent of the national inventory of around 565 million square feet of office space.
The Office Market
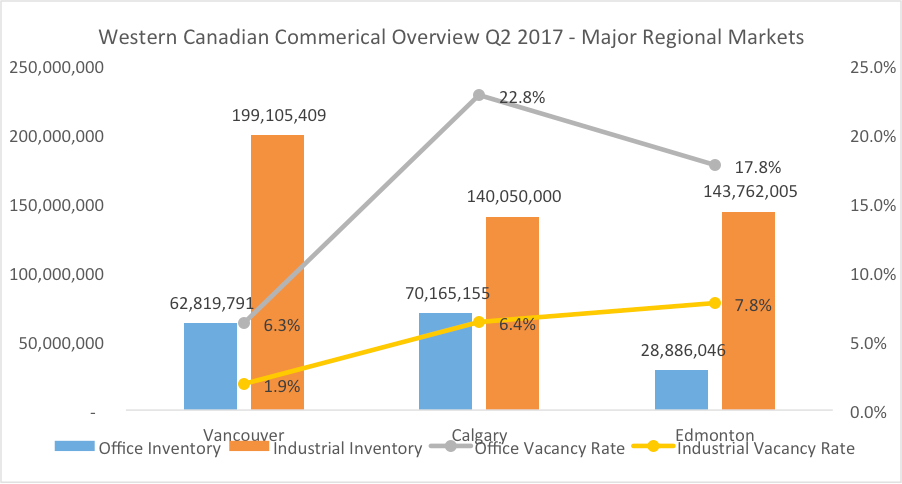
Of the three major markets, Calgary has a slightly larger inventory at approximately 70 million square feet. This is followed up by Vancouver at 63 million square feet and Edmonton at 29 million. That being said, of the two Albertan markets, Edmonton is just under 18 per cent regional vacancy rate and Calgary is nearing 23 per cent, whereas Metro Vancouver has experienced a significant decline since the last supply boom, resting at a 6.3 per cent regional vacancy rate.
The demand in the Vancouver market is largely driven by the technology sector, which currently represents 18 per cent of the downtown market, and the current demand for space is nearly one million square feet (based on mandates tracked by Colliers internal reporting and understood as a proxy to the market). The decline in vacancy and solid market fundamentals is a result of the Vancouver market maturing and diversifying over the last couple decades, moving away from predominately mining and forestry related industries to professional service firms, health care, education, consumer goods, and, of course, technology.
The Calgary office market is still largely energy focused, with nearly 77 per cent of the downtown office market involved in the energy market: 55 per cent in oil and gas exploration, 10.66 per cent in engineering and energy services, and 10.89 per cent in pipeline midstream. That being said, Calgary is starting to see more technology related industries absorb high quality office space due to the opportunities with high vacancy and lower rental rates. With the market still recovering since the drop in oil prices, different industries within Calgary have seen this as an opportunity to attract talent from the Energy sector and grow their organizations within the market.
The Edmonton office market, albeit much smaller than Calgary and Vancouver, holds approximately 62 per cent of the inventory within its downtown area. This is further divided by the financial district (69 per cent) and government (31 per cent). The financial district is currently holding vacancy levels above the regional level at 20.4 per cent, where the government market is at 13.3 per cent.
Looking at the regional office market as a whole, the vacancy has seen steady increases since Q1 2014 where it was 9.83 per cent, moving up to 17.79 per cent as of Q2 2017. The Edmonton market is largely driven by demand from the Financial Services industry and the local and provincial governments.
The Industrial Market
Vancouver, Calgary and Edmonton are home to nearly 483 million square feet of industrial space, of which Vancouver (around 199 million) holds the most inventory at 41 per cent (around 199 million square feet), followed up by Edmonton at 30 per cent (144 million) and Calgary at 29 per cent (140 million).
From vacancy standpoint, the Vancouver industrial market is dealing with far more issues on available space with a vacancy rate of 1.9 per cent, versus Calgary and Edmonton at 6.4 and 7.8 per cent, respectively. The combined vacant space between the three markets equates to just under 24 million square feet.
One of the major contrasts between the three industrial markets is geography. The Vancouver industrial market is not only dealing with zoning and policy issues, but is constrained by a variety of geographical barriers. In contrast, Calgary and Edmonton have the ability to continue to expand development outward, benefiting from a sprawling geography – however, this type of expansion does require investment into infrastructure to support the movement of people and goods.
A further distinction between these industrial markets lies in the types of industries that occupy space. Both Calgary and Edmonton have a much greater reliance on the energy sector, where the predominant industries in Vancouver are logistics, distribution and consumer goods. With the direct connection to Asia and two active water ports and an international airport, the traditional industrial industries in Vancouver largely rely on “last mile” distribution, and thus the necessity of highway infrastructure is crucial.


