NOTE TO READERS: This is a corrected version of an article published May 14, which was based on an infographic and study of months of housing inventory across Metro Vancouver. The study authors at Zoocasa retracted this study, as it contained a series of errors, and have based their new infographic and study on sales-to-new-listings ratios across the region.
It’s clear that Metro Vancouver is in a housing market slowdown, with listings piling up and benchmark prices declining. But how does this break down by municipality, and which areas are in a buyer's market?
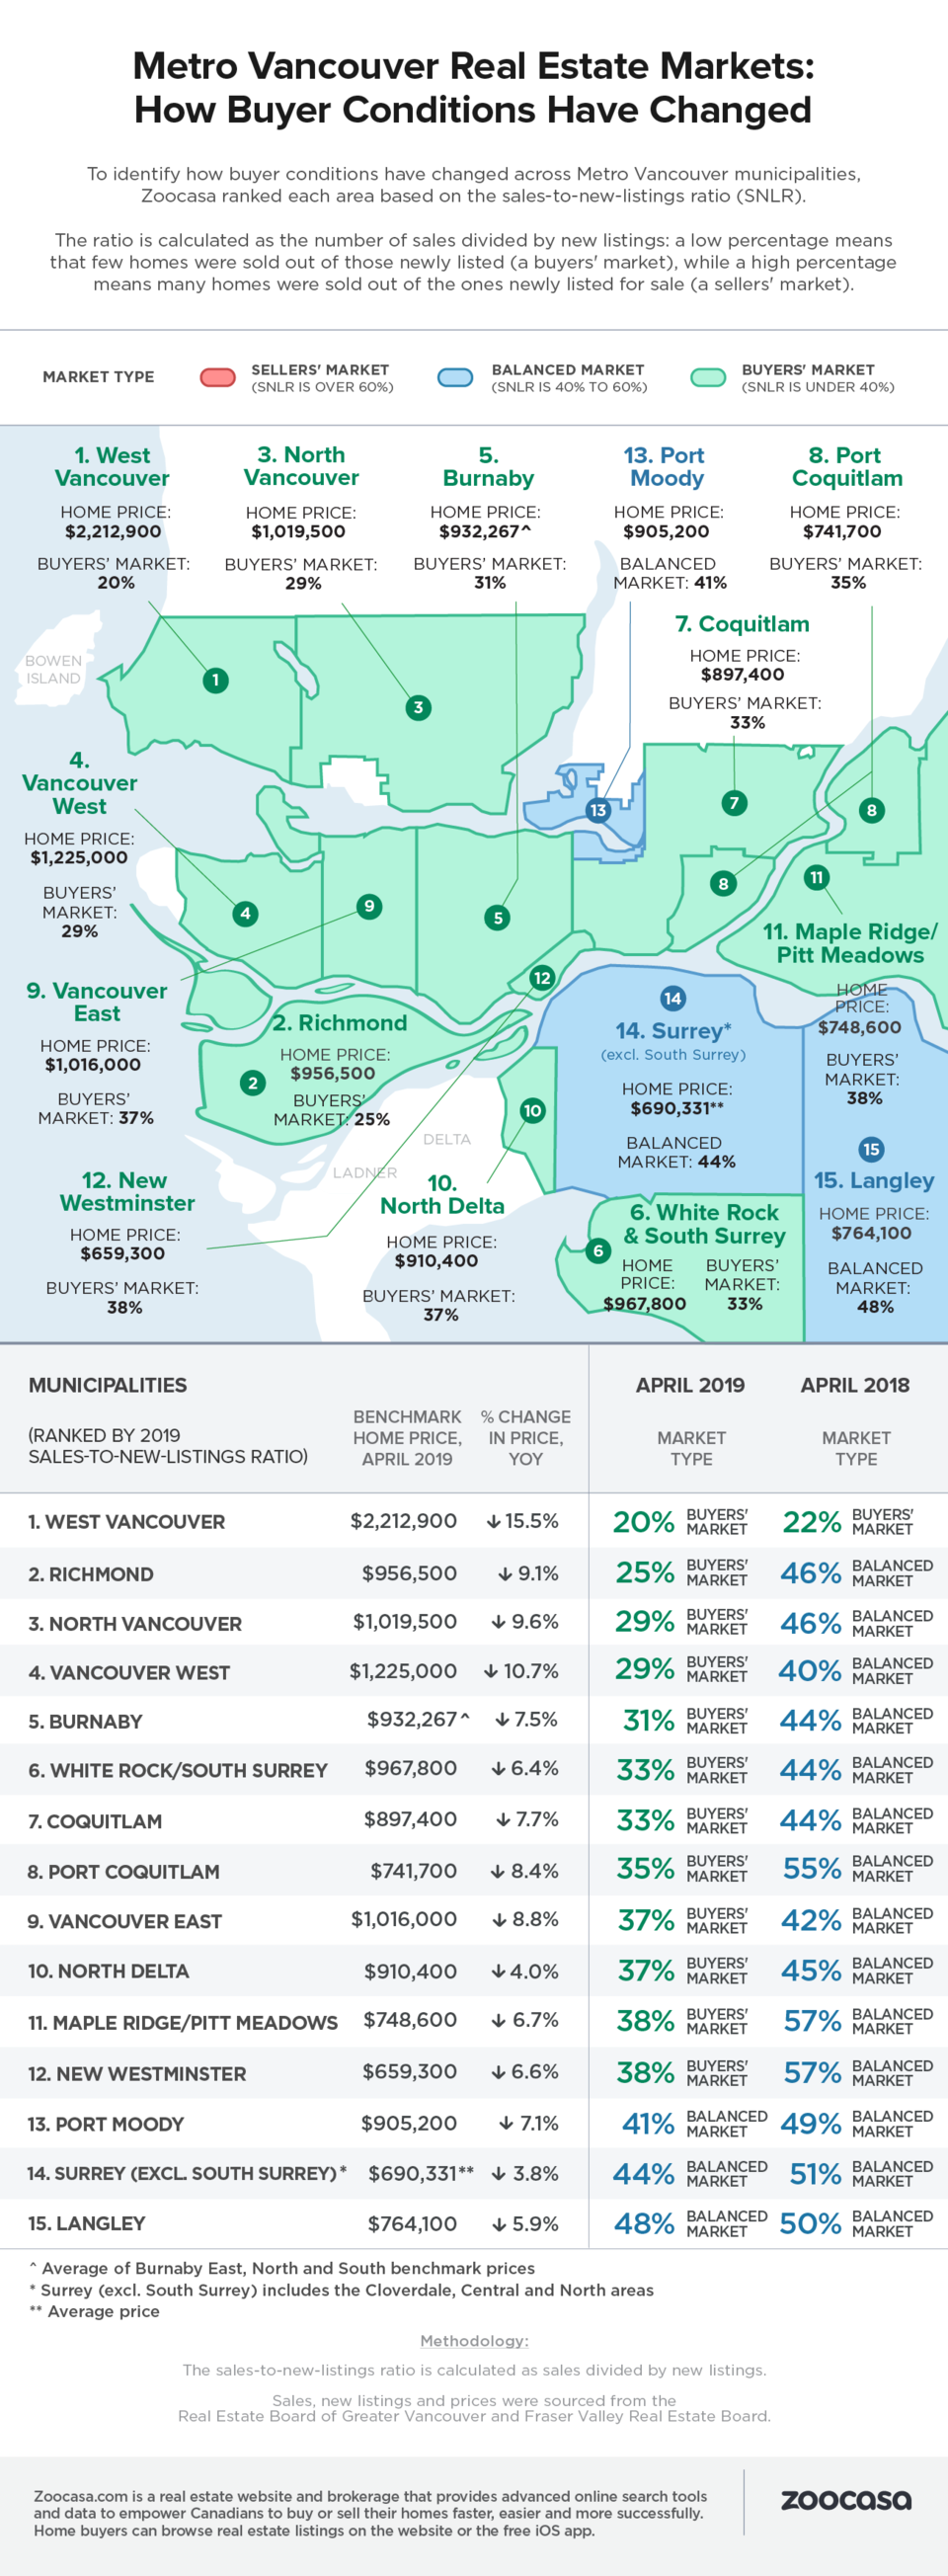
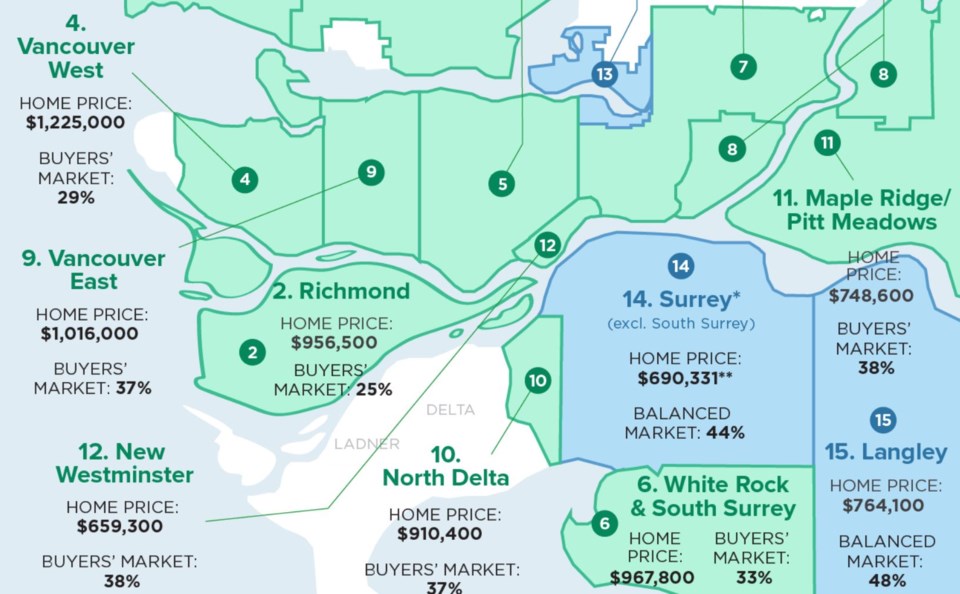
Real estate website Zoocasa created an infographic map of the region, ranking each area by how deeply it has receeded into a buyer's market or remained balanced. It used the sales-to-new-listings ratio (SNLR), which is the number of sales in a month as a proportion of the number of new listings in that month. The SNLR is an alternative measure of buyer's and seller's markets to the sales-to-active-listings ratio used by the real estate board.
A buyer's market, when measured by SNLR, is anything under 40 per cent, a balanced market is 40-60 per cent and a seller's market is over 60 per cent.
The infographic also lists the SNLR one year previously for comparison, as well as each area’s composite benchmark home price and year-over-year price decline.
West Vancouver was unsurprisingly the municipality in the deepest buyer's market, now at 20 per cent. This means that one home was sold in April for every five that were listed in April. West Vancouver was followed by Richmond, North Vancouver and Vancouver West, all of which were under 30 per cent.
Of the 15 municipalities studied, Langley was found to be the most robust area, with a balanced market at 48 per cent.
Check out the full updated ranking of 15 municipalities in the infographic below.