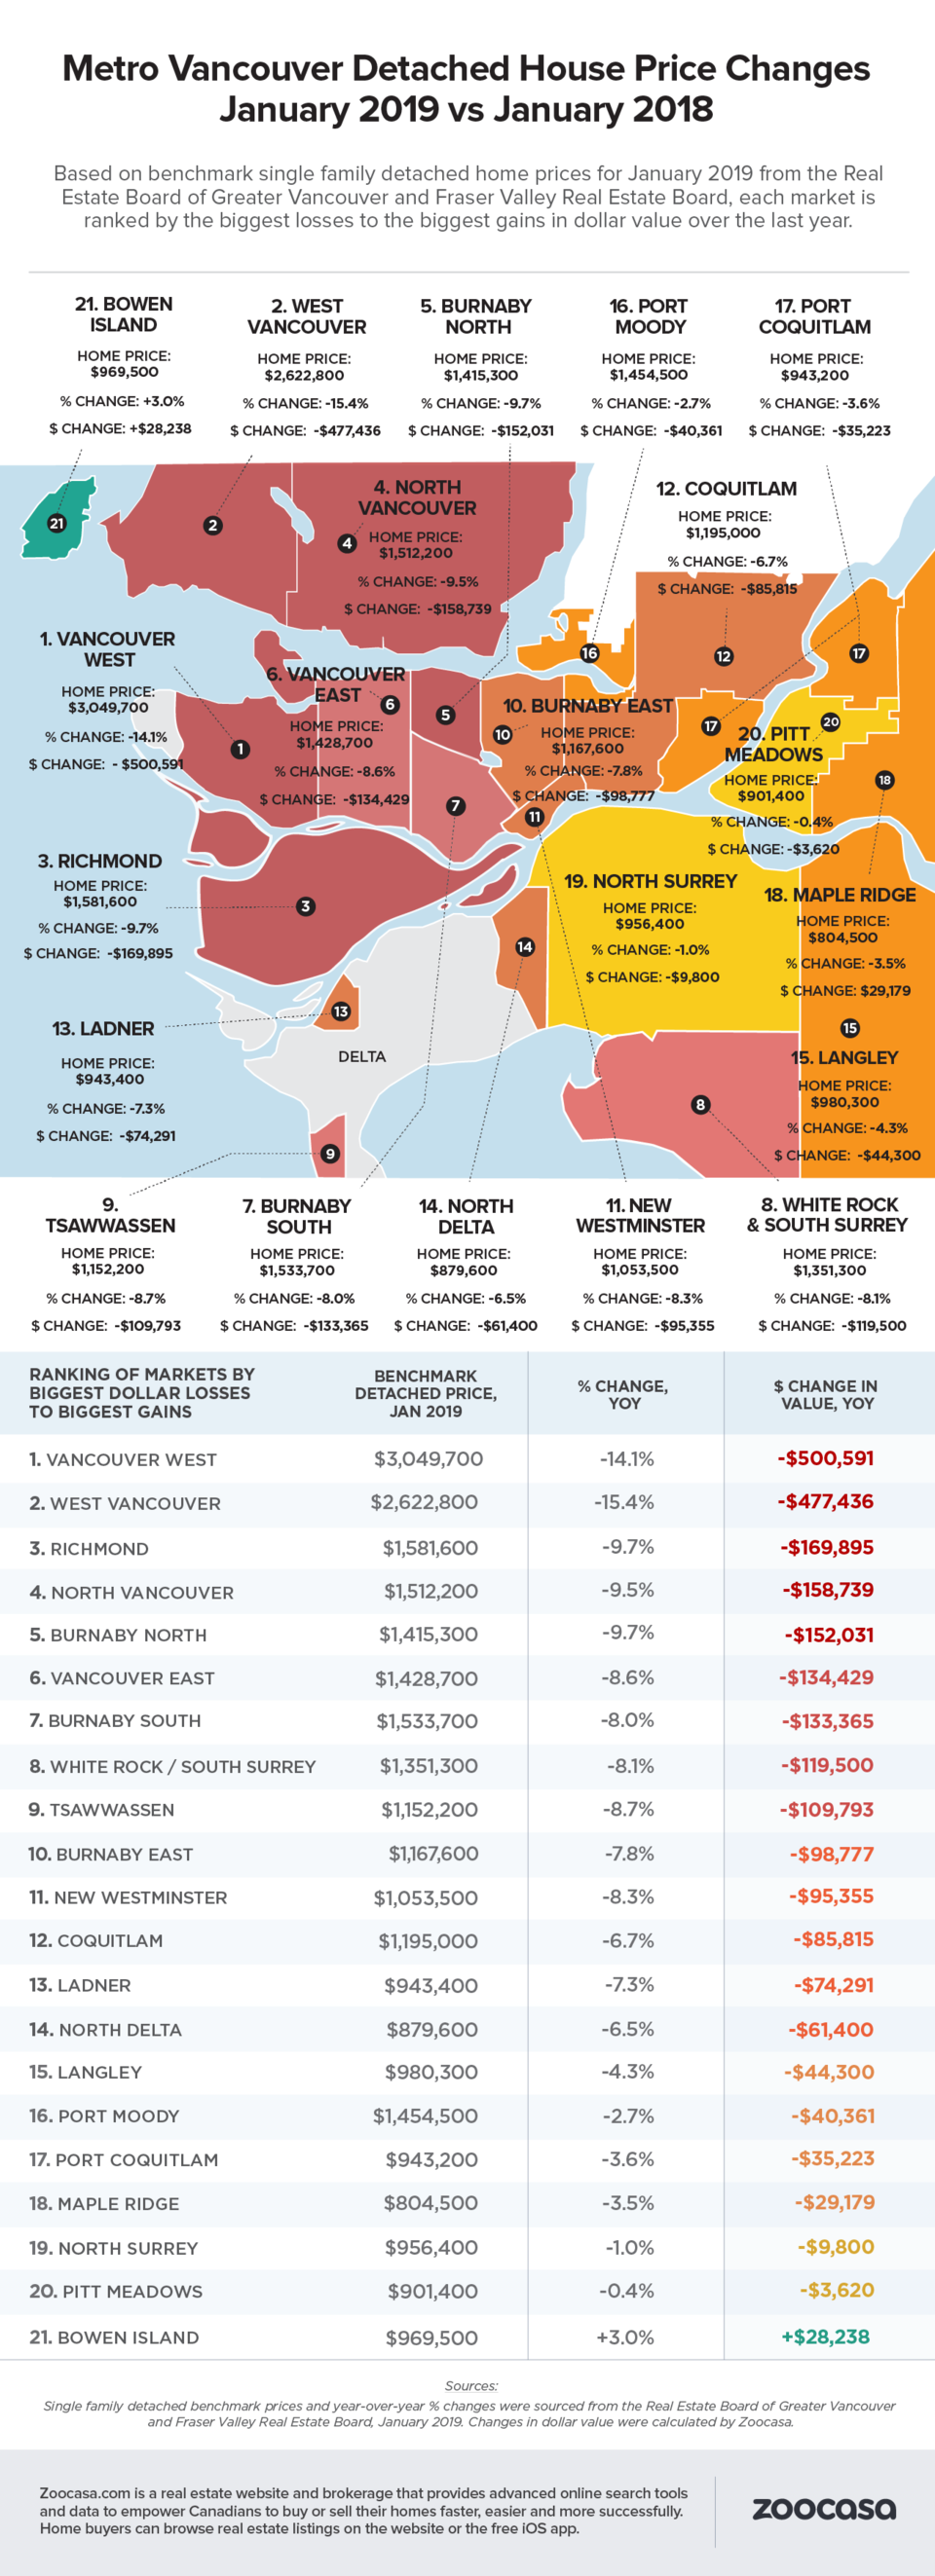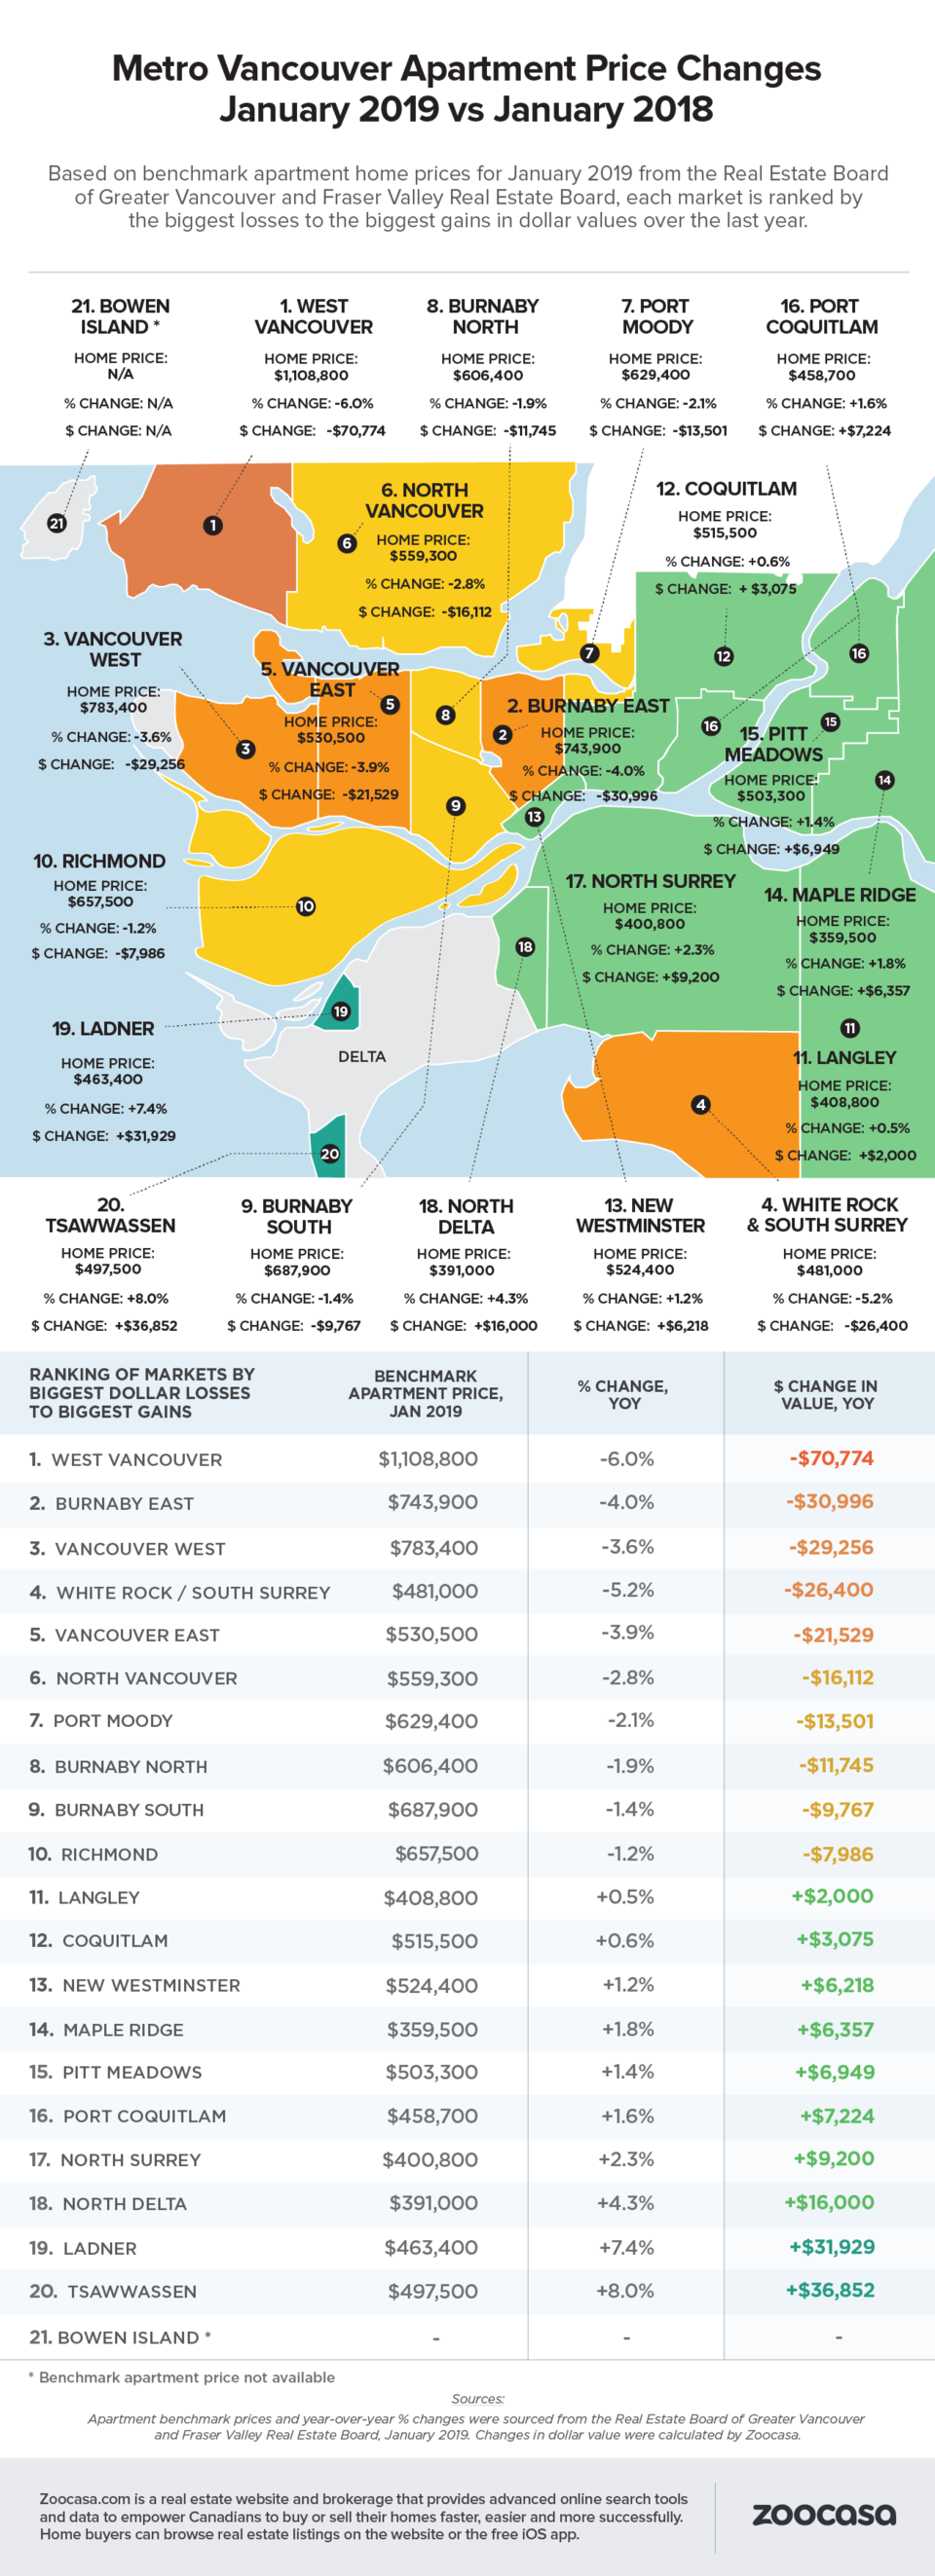
Earlier this week, the Real Estate Board of Greater Vancouver issued its monthly stats report on home sales and prices, revealing that benchmark prices were sliding at an increasing rate.
Property website Zoocasa took this data one step further, and created two infographics – one for detached homes and one for condos – that show how much in dollar terms each area’s typical price has dropped over the past year.
It reveals that the vast majority of areas within the wider region saw significant benchmark price drops in the detached sector, with Vancouver West’s (West Side, Downtown West and West End) typical single-family home prices having lost more than half a million in value from a year ago.
Condo values, however, largely held their own around the region. Ten of the 21 areas examined (some of which fall within the Fraser Valley Real Estate Board) saw typical condo prices increase year over year, while 11 saw price declines. However, all the condo price changes, whether a rise or a fall, were relatively modest compared with the detached market.
Check out Zoocasa’s full infographics and price-drop rankings, below.